
Soomla offers you the opportunity to have a detailed insight into the Monetization Benchmarks Report for Q1 2019. The report is the contined edition of their previously published report. Here, the stats will be shown on the basis of YOY figures i.e., Q1 2019 Vs. Q1 2018. The published report also distributed to show the significance of implementing monetization strategies that are focused on grabbing 1st impressions.
The company is the industry leader engrossed in offering benchmarks for ad measurement. It recently released its well-researched report based on Monetization Benchmark for Q1 2019. In short, the report is a descriptive guide providing factual information about monetization value gained from 100 million users based out of 8 different countries.
Let’s have a glimpse at the contents that the monetization report has covered to prove the point of various app monetization stats:
eCPM (Effective Cost Per Mile)
eCPM is basically the attained outcome of the ad revenue which is generated by a banner or ad campaign. The report divided eCPM into different parts to make business owners and associates aware of the actual facts. Here, publishers are allowed to have a comparison between ad network effectiveness as a reliable monetization channel.
1. eCPM By Country
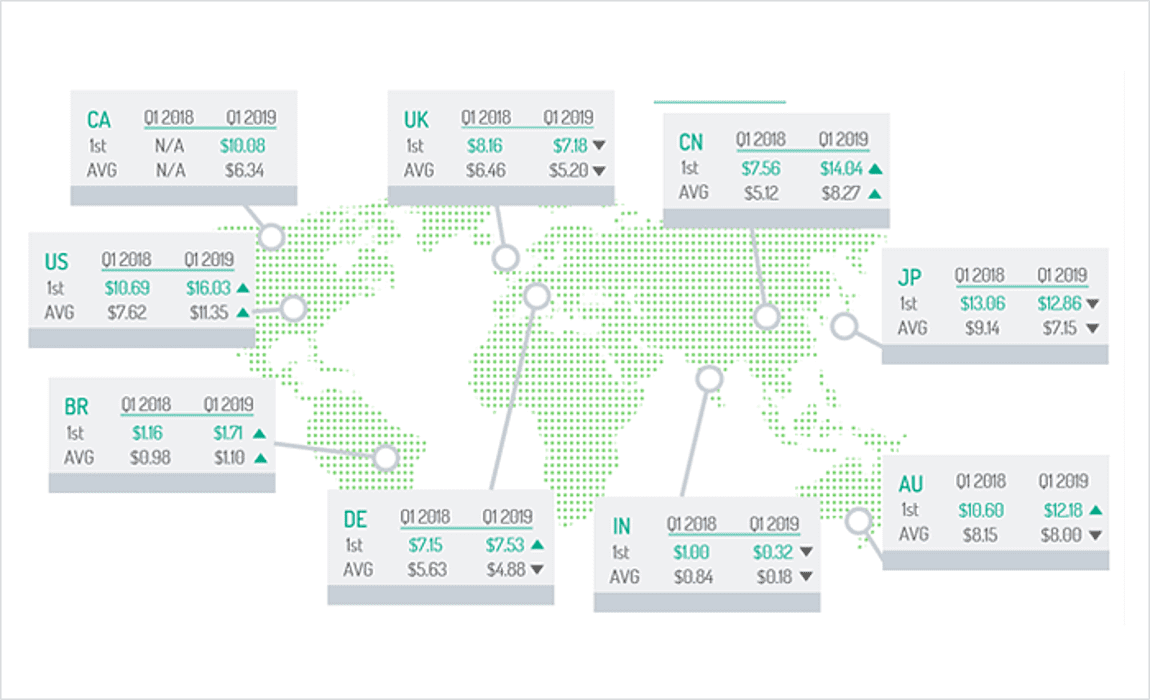
The company brought the stats in front of the industry to describe how eCPM is facilitating each country. The given image shows the actual eCPM paid for the 1st impression and on the other hand overall average eCPM impression paid by each country. The stats include both Android and iOS users.
2. eCPM By Platform
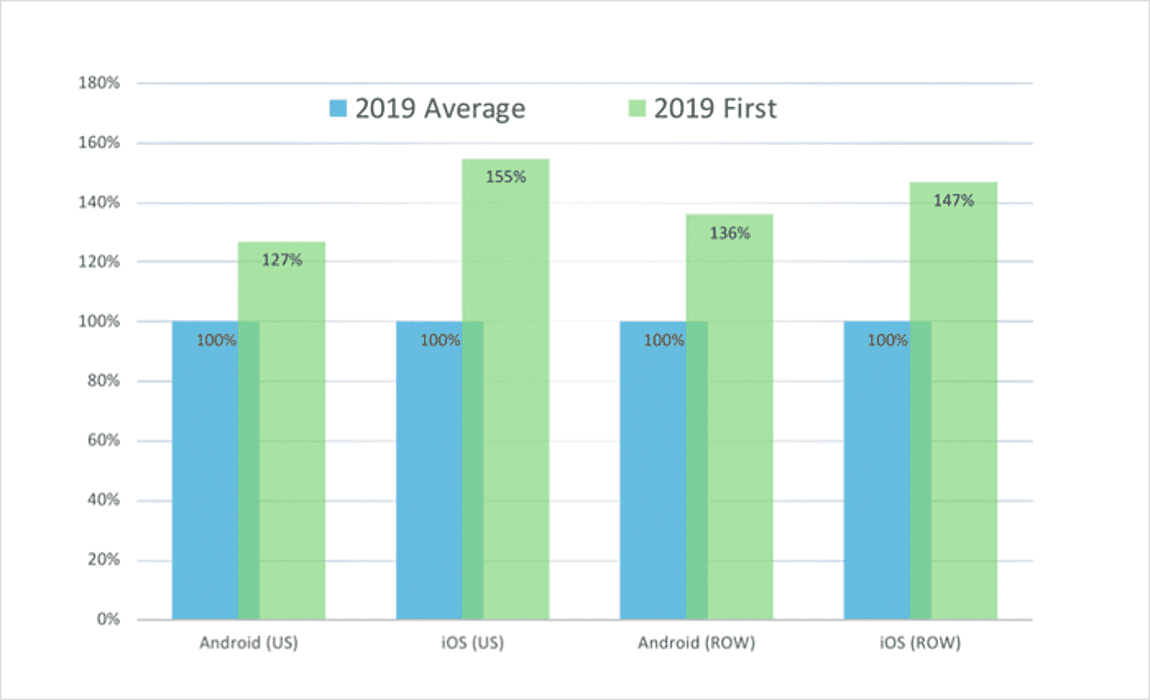
Here, you can see the chart where the difference between the 1st impression eCPM and the Q1 2019 average eCPM received per platform which is further compared with the benchmark of Q1 2018. The information is depicted in the graph where the average impression of eCPM is 100% and the first eCPM impression will be presented in comparison.
This can be described as the Android US eCPM is 27% higher than the average eCPM.
3. eCPM By Per Ad Type
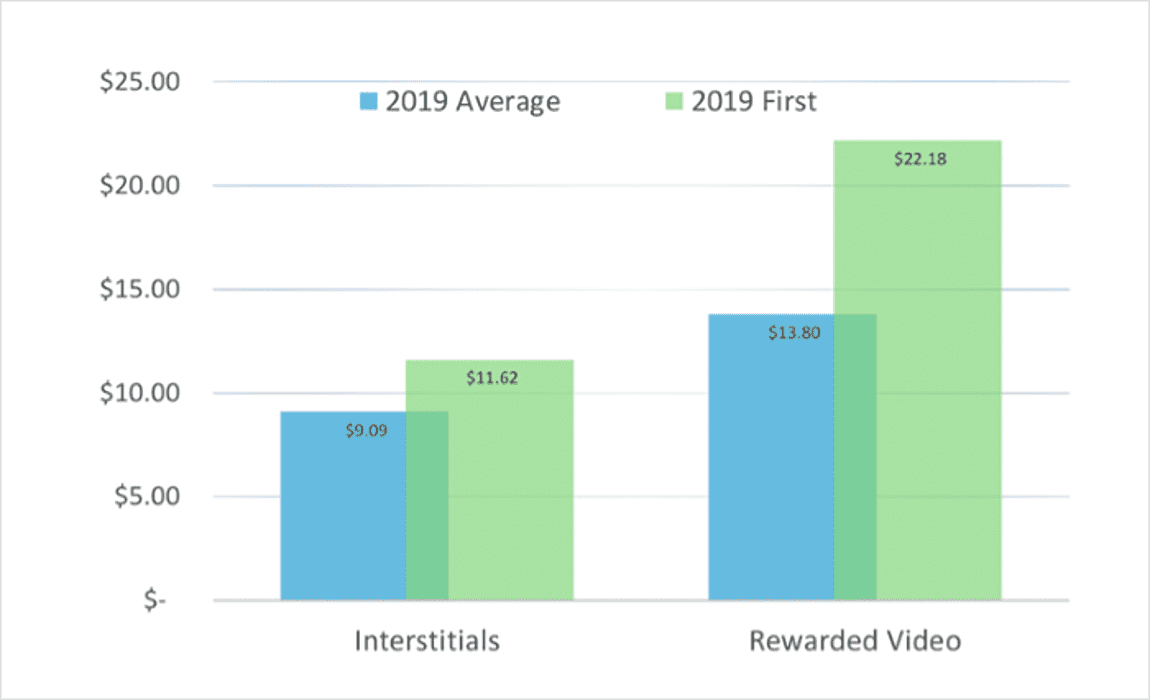
Through this section, you will get a breakdown of the major ad types including interstitials and video interstitials Vs. rewarded video stats. You’ll also be able to get a go through to the respective average and 1st impression eCPM stats. Have a look at the below chart which is designed to display the average eCPMs gathered for each ad.
Note: The facts are being grouped by Interstitials combining play-able and video ads.
-
eCPM Breakdown - US
Here, you can take a look at the eCPM difference on behalf of ad-formats for the US. Soomla prepared this well-sorted report to provide the actual eCPM numbers attained for each ad type. These have further been measured for apps, users, and platforms. Here, the users can also notice the drastic difference in the rewarded video ad type.
-
eCPM Breakdown - ROW
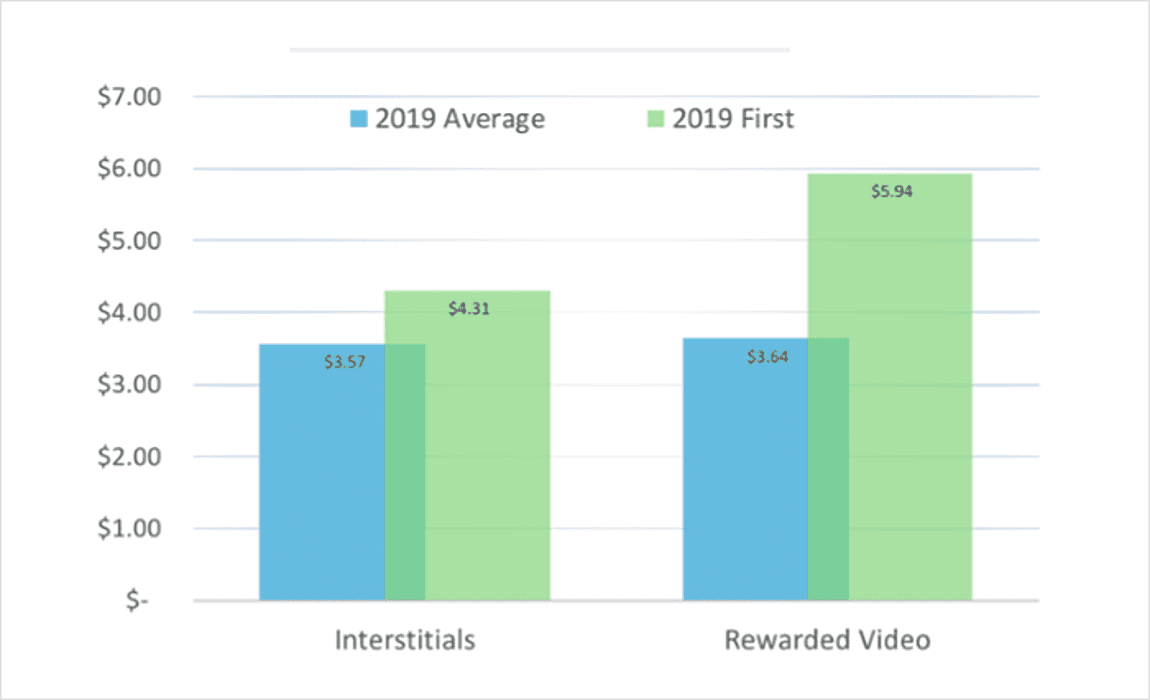
The process will repeat here the difference is that the stats would be on behalf of the ad formats being used across the ROW (Rest Of The World) countries. Publishers and ad marketers can utilize this chart to set their benchmarks for per-ad type to get better and expected eCPMs.
Note: Here, you’ll see that Interstitials eCPM was calculated higher than in 2019.
Rewarded Video US
The company prepared this section by conducting a comparison between the ads served through rewarded video ads. The report is assimilated by categorizing the ad types as per their analysis. It’s up to the developers, how they analyze and decide which ad type is the most compatible with their category apps. This is how they will be able to manage the balance between optimal revenue and churn control.
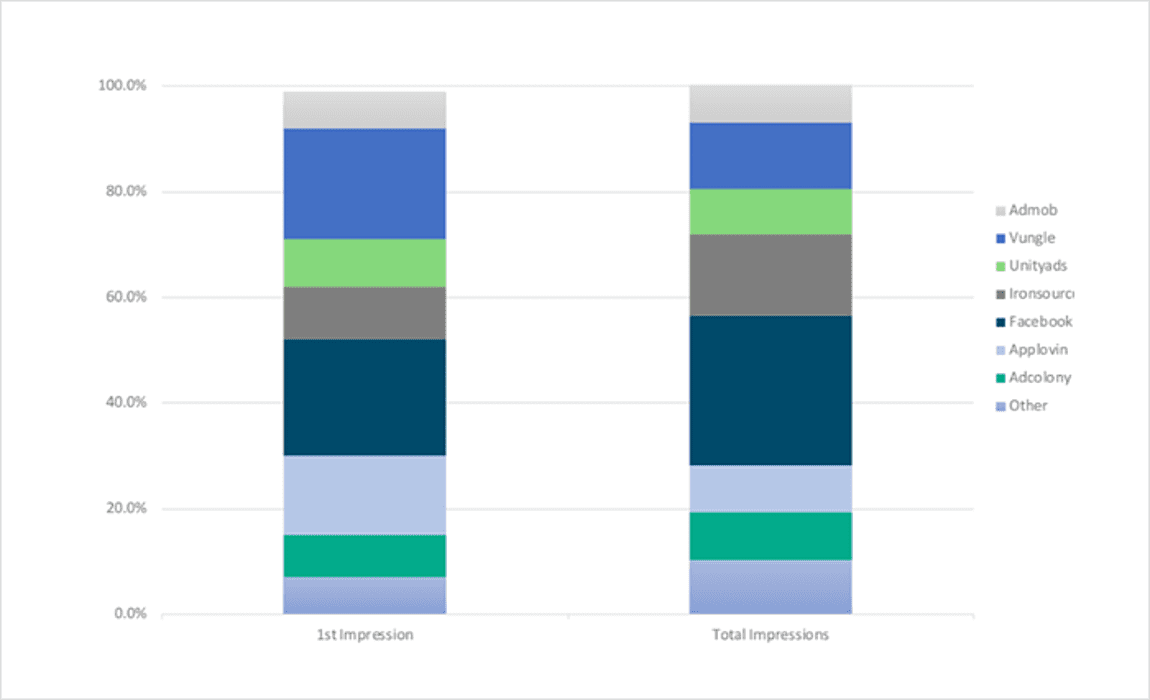
Results
The stats say that Facebook is one and only undisputed network leader which is used to share rewarded videos, both in overall and first impressions.
Similarly, you can check the Rewarded videos stats for the ROW (Rest of the world) countries by getting access to the detailed report.
Ad Network Comparison
This section of the app monetization report is being prepared to compare the performance of a variety of market monetization providers. The stats are helpful for those who are looking for the service providers maintaining the significant volume of rewarded and interstitial video ads.
Here, the prime target is to facilitate publishers with the full spectrum of details about each ad providers belong to several categories.
Data analysts associated with Soomla made research for the 27+ different ad service providers that have become the monetization partners supporting the company for this amazing comparison.
Have a glance at a few monetization partners:
Ending Note:
Soomla has brought this report for the industry specialists who are targeted to tremendously lead in the in-app advertising sphere. The company distributed this well-defined and detailed report to render publishers insight into the revenue they generally generate by running the advertising campaigns.
If you’re one of them who wants to beat this advertising industry with the planned strategy, get our detailed report where you can have figures and stats about each and every app monetization related facts.
Hope you find the report interesting and worth using to plan your business monetization. Download the complete report if you want to know more about global monetization statistics.


